English version of the materials are work in progress!
Expect bugs, typos, and other issues. The English version is expected to be completed during spring 2026.
Data Warehousing
Data warehousing refers to the systematic and periodic copying, transforming, and refining of data from several different sources into an environment intended for data analysis. This target database or databases is called a data warehouse.
General About Data Warehousing
Organizations that have only one database are rare. Organizations have more and more data, and the data is located in different databases in very different formats. Since operational databases are intended primarily for enabling daily business operations, they rarely satisfy the information needs of organization managers or analysts. From the perspective of data management, data warehousing significantly contributes to the success of an organization.
This subchapter introduces the general architecture and purpose of data warehousing.
Architecture
The figure below illustrates the general architecture of data warehousing using a bank as an example. The bank has two operational database systems enabling daily business (online transaction processing, OLTP): payment traffic and stock exchange. Additionally, the figure shows an external credit institution's database system credit information, used by the bank. These database systems contain so-called source databases, which usually resemble logically the databases already discussed in this course.
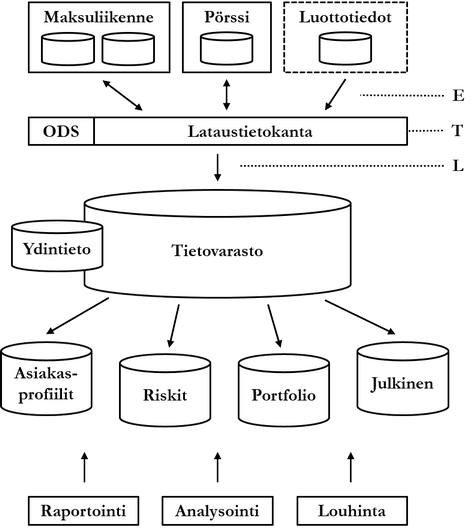
Desired data is collected (extract, E) from source databases into a so-called staging area (lataustietokanta). Since data is collected possibly from very different sources, it must be transformed into a unified format. Additionally, poor quality, erroneous, and otherwise unwanted data is filtered out, and desired information possibly derived. All this transformation process (transform, T) is performed in the staging area. The staging area consists of a set of middleware in addition to the actual database. Finally, the transformed data is brought (load, L) into the actual data warehouse, usually periodically as a batch run, for example once a week or at the end of every quarter.
The staging area is emptied at regular intervals. The data warehouse is depicted in the figure as a single database, but usually a data warehouse consists of several databases. The ETL process implemented by middleware is complex depending on the needs of the domain, especially regarding data quality control. It is also possible that at the end of the quality control process, data is fed back into source databases. This way, erroneous or otherwise incomplete data is also corrected in the source databases.
Finally, the data in the data warehouse can be divided into so-called data marts. Data marts can be physical databases or they can be implemented purely with logical data structures such as views. Dividing the data warehouse into data marts facilitates understanding of the complex structure and limits end-user access rights to refined data. Data in data marts or the data warehouse is processed further by reporting, analyzing, and mining.
Purpose
Data warehousing can be an internal way for a company to achieve benefits, or data warehousing can itself be a business. The roots of data warehousing are in market research, where all data is collected from external sources. Once an organization's data has been collected into a data warehouse, the data can be utilized in various ways to promote business, for example as an aid in decision-making, in forecasting markets, Or in mapping threats.
From a more technical perspective [20], the purpose of data warehousing is to combine inconsistent and time-variant data from heterogeneous and legacy systems regarding specific subject areas (subject-oriented) into permanently stored (non-volatile) and meaningfully searchable form.
The utilization of data warehouse data can be divided from the perspective of pursuing benefits into three parts:
- Reporting, which provides simple answers to simple questions like "What happened to loan interest rates in the first quarter of 2015".
- Analysis, which provides answers to even complex questions like "What happened to the sales of red products in 2014 and why". Tools and techniques for analyzing business intelligence are generally called OLAP (online analytical processing).
- Data mining, which provides even complex answers to complex questions like "What development is likely to happen in France's GDP in 2020" or "What interesting things will happen in the company's personnel next year". Data mining is discussed at a general level at the end of this chapter.
Master Data
An organization's central information, or master data, is gathered in one and only one place to ensure correctness. Master data is information that is recognized as correct in the organization and shared among actors. Master data can be critical data for the organization's operations (for example, bank account information), but master data does not need to be limited to it. Two key concepts related to data are associated with master data and its management: system of entry (SOE) means the source of data (e.g., ERP system) that has been accepted, i.e., recognized as reliable. Since there can be several accepted data sources, there must be a way to ensure which of the accepted data items is correct when conflicts arise. The concept system of record (SOR) means the version of data recognized as correct. There can be only one of them, in which case it is not even theoretically possible for the data to be contradictory.
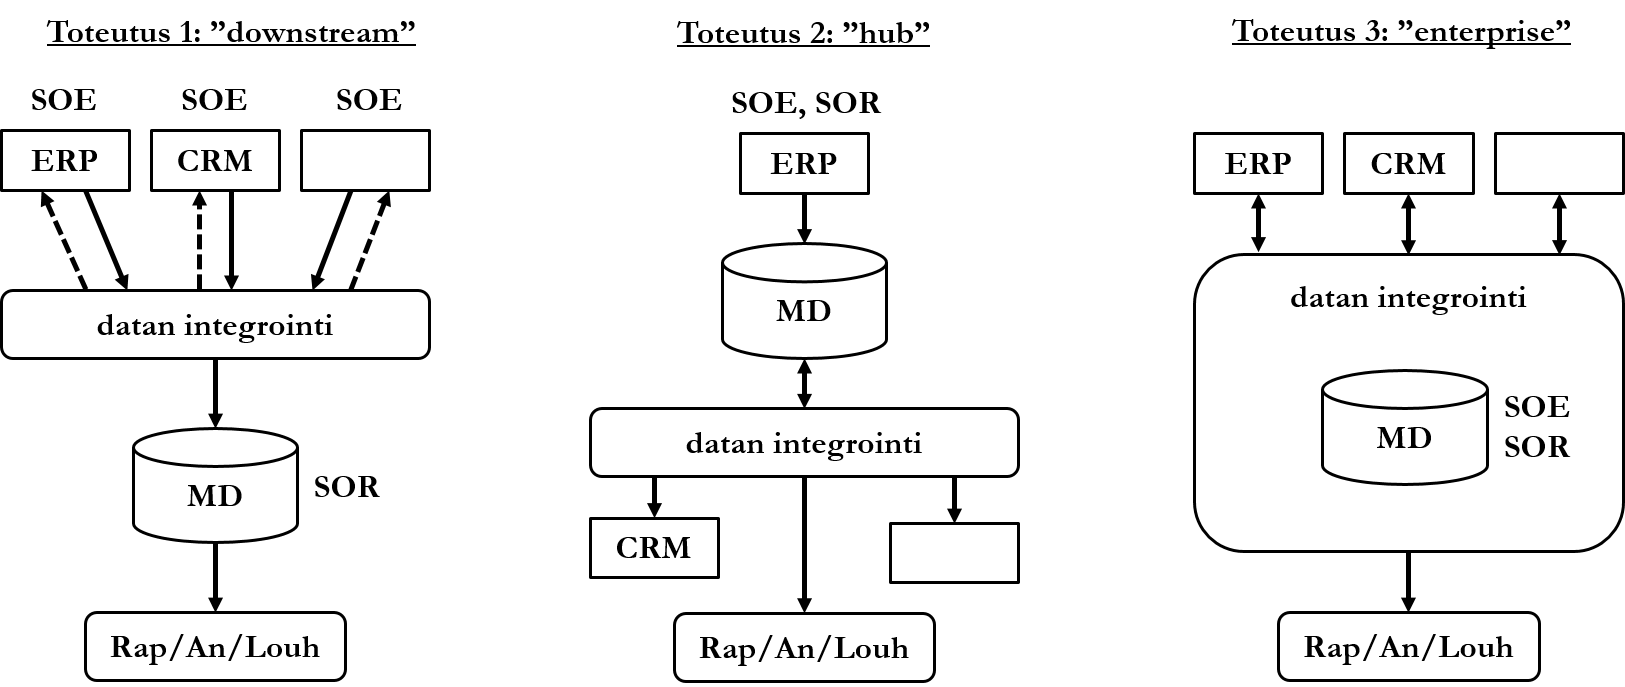
- Downstream implementation is usually the simplest to implement, but tracing data back to the correct source system can be challenging. In this implementation, the organization's information systems act as accepted sources of data. Data is brought into an integration process that resembles the transformation process (transform) of data warehousing architecture. Data can be fed back to source systems if necessary. After integration, the data is brought into a structured database that acts as correct data. This data is further used for reporting, analysis, and data mining.
- In Hub implementation, one source system acts as the only accepted data source and the correct version of data. Data is fed to other organization's information systems in the format that the information systems need it.
- Enterprise implementation is usually the most demanding to implement. In it, the master database acts as both an accepted source of data and correct data. although data is originally brought from source information systems, it must pass the integration process before the data is found to be correct. Data found to be correct is fed back to source information systems.
Developing a Data Warehouse
The phases of developing a data warehouse follow in main points the development phases of an information system. The phases are not strictly sequential, but partially overlapping, and phases can be returned to. Development is usually done by a group consisting of programmers and analysts (or other experts in the domain's business logic). Collaboration between actors is particularly important in data warehousing development.
Analysis and Design
First, data warehousing priorities or focuses must be selected, i.e., what is wanted to be achieved with data warehousing. Priorities must be clearly distinguishable, and there can be several of them. A priority can be for example:
- To whom can loans be given and at what interest rate?
- What did those who viewed product X in the online store eventually buy?
Next, it is clarified with what kind of information the requirements are achieved.
Additionally, it is clarified what data is needed to derive the necessary information, and from which sources the data is obtained. It is also decided how long data is kept. For example, a security company must keep event notifications for five years according to law. On the other hand, an online store might want to keep its sales history since the year of establishment.
Design includes logical and physical design: design of database schema, indexes, information needs and access paths, hardware, and integration. OLAP tools are also selected that support information needs and selected techniques. If the data warehouse is implemented with a relational database, possible summary tables and views are designed. Summary tables are tables containing derived data. This derived data usually answers frequently recurring information needs requiring aggregation. With a summary table, data does not need to be aggregated in connection with every query, but the data is already aggregated in the table.
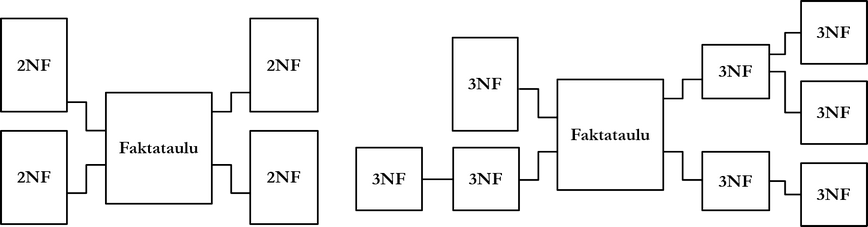
The schemas of data warehouses and operational databases differ from each other. Three identified schemas of data warehouses are so-called star, snowflake, and starflake models. Common to all models is a fact table or fact tables located at the center of the database schema. A fact table is like the relationship relation discussed in Chapter 3, which links multiple objects to each other and contains measurable data about events, for example orders or bank transfers. It is common for a fact table to have a multipart primary key consisting of primary keys of other, so-called dimension tables. Dimension tables are like entity relations: they contain descriptive data about for example products or customers. In addition to its primary key, a fact table can have additional columns.
A star model is a data warehouse schema whose dimension tables are not highly normalized. In a schema according to the snowflake model, dimension tables are normalized for example to the 3rd normal form. A starflake model is a so-called hybrid model, where some dimension tables are highly normalized and others are not.
In the design phase, it is also decided whether to use an operational data store (ODS). With it, real-time operational data can be processed with OLAP tools, even if data has not yet been brought to the data warehouse. The weakness of the technique is growing storage space and data transfer requirements.
Implementation, Deployment, and Maintenance
At this stage, the data warehouse and staging area are implemented. Collection of data from source databases (extract), processing of data in the staging area (transform), and bringing processed, high-quality data to the data warehouse (load) are implemented. Potential problems in ETL phases (extract-transform-load) can be for example
- Data is collected from many different sources. Data from different sources may be redundant, and redundancy can be difficult to detect. For example, one system stores product numbers in a different format than another.
- Considerable amounts of data may move to and from the staging area. When is it operationally acceptable to load the database system with data warehousing?
- Is an operational data store used?
- How is data quality measured and how poor quality must data be to be rejected?
- How to react and prepare for e.g. logical structure changes, especially in external source database systems?
The middleware of the staging area is implemented, or if third-party software is used, connected to the data warehouse.
At this stage, the data warehouse and OLAP tools are introduced to end-users using them. Additionally, training is provided on how information is retrieved from the data warehouse and how information is utilized.
If data marts have not been designed in the design phase, they can be created at this stage. Data marts serve specific information needs, for example with a marketing data mart, marketing department analysts can get information about product sales volumes. Data contained in data marts is either collected entirely from the data warehouse or it can contain other data as well. The first interpretation is called the Inmon school [20] and the latter the Kimball school [23].
Data contained in data marts is designed to correspond to priorities. Priorities can be very diverse, for example
- Based on geographical location, for example Jyväskylä offices' data mart.
- Based on information needs of different company departments, for example bank risks and customer profiles.
- Based on data aggregation, for example entire company sales globally.
- Based on market areas, such as company x's and y's share of the market.
- Based on data sensitivity, for example some data mart can be public, another only for organization management's use, and data of a third for sale to third parties.
The table below summarizes differences between data warehouses and operational databases (OLTP) from different perspectives ([15], [40]).
| Operational Database | Data Warehouse | |
|---|---|---|
| Purpose | Daily business | Analysis, planning, problem solving |
| Data Source | Application, users | Source databases |
| Data Granularity | Precise | Aggregated, precise |
| Nature of Data | Dynamic snapshot | Static history, aggregation |
| Data Volume | Small, medium | Large, massive |
| Search Queries | Simple, returning few rows | Complex, aggregating |
| Modification Queries| Coming from end-users: | small, fast | Batch run: large, slow | |
| Indexes | Few | Many |
| Normal Form | Highly normalized | Denormalized |
| Serves | Almost all customers | Part of users |
| Usage Pattern | Repetitive, predictable | Unstructured, heuristic, unpredictable |
Data Warehousing and Business
This subchapter examines the development of concepts and techniques related to data warehousing from a business perspective.
Data Mining and Related Development
Data mining refers to information refinement from large amounts of data implemented with algorithms based on statistical methods for use in business decision-making. Data mining could be said at a general level to differ from analysis in its complexity and in that data analysis aims to answer a predetermined question, whereas data mining aims to find interesting models from data even if the end-user did not specifically ask anything.
Data mining can be applied to data warehouses or operational databases. Data must be prepared for mining before mining. Preparation can include similar operations as data warehousing processing phase (transform):
- Correct, erroneous, and noisy data are separated from each other. By noisy data is meant data whose values are potentially erroneous, for example 20% of registered users were born on January 1st.
- It is decided what to do about missing values. For example, patient records may have many null values due to gender or age.
- The number of attributes to be mined is reduced so that only a vertically partitioned subset of data is examined.
Let's look next at a few high-level examples of data mining techniques and what can be achieved with them. The division of techniques is loosely based on source [31]. The presentation is not comprehensive.
Supervised Learning
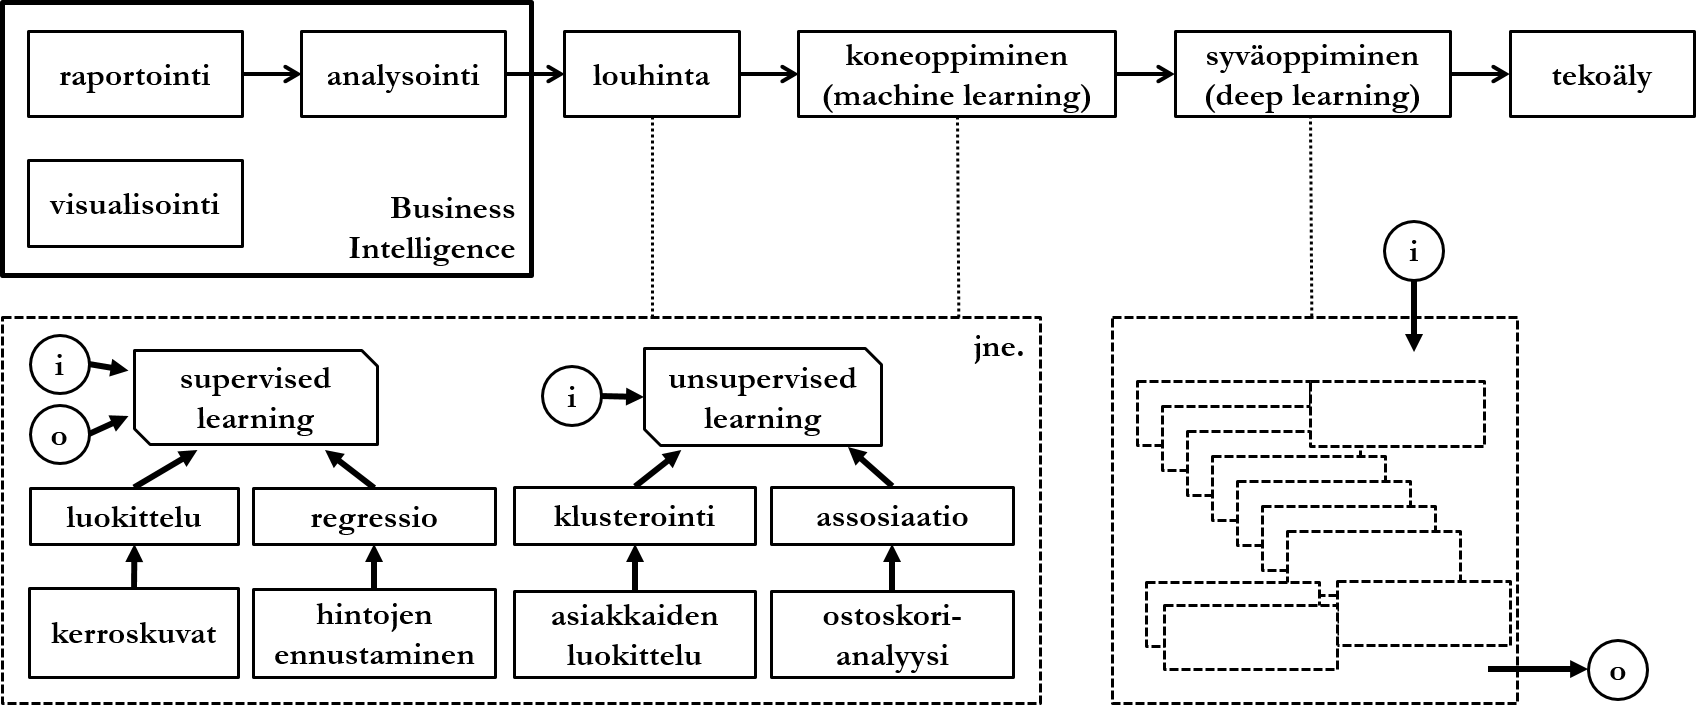
Data mining techniques are often divided into supervised, unsupervised, and semisupervised learning. Supervised learning is a general name for techniques that operate according to given input and expected output. Simplified, this means that in addition to the actual data to be analyzed (input), the algorithm is given training data (expected output), against which the input is analyzed.
Classification is one of the most common applications of data mining. Classification algorithms aim to predict values of discontinuous (discrete) variables based on values of other variables in data:
- A student who has not done any demo tasks usually fails the course grade.
- Customer A usually uses their credit card in Finland, Sweden, or Estonia.
- From tomography images, it can be identified that this patient does not have lung cancer.
Based on the results of classification algorithms, follow-up measures can be taken. A system that acts as support for student learning can send the student a reminder about demo tasks, or a bank can block the use of a customer's credit card based on anomalies.
Regression algorithms aim to predict values of continuous variables based on values of other variables in data:
- Sales prices of detached houses will likely rise in the next quarter as the number of potential buyers increases.
- Global revenue of devices related to augmented reality will likely exceed the 100 billion euro limit in 2020.
The operation of regression algorithms is based on analyzing historical data, so-called time series data. A common technique for implementing regression algorithms is neural networks.
Unsupervised Learning
Unsupervised learning refers to techniques that do not have a special, pre-given question or setting, but aim to find interesting models from data. Algorithms are given only input.
Clustering or grouping algorithms aim to divide data into groups according to data characteristics:
- Customers X, Y and Z eat a lot of bread because they have bought at least three toasters in the last year.
- Viruses can be divided into groups A, B, C and D according to the amount of genetic information they contain.
- Documents J, K and L deal with cats because the word cat is mentioned in them frequently.
The results of grouping algorithms are often visualized with 2- or 3-dimensional squares or cubes, where axes describe values of attributes relevant to the sets. Simple grouping is for example the TF-IDF method (term frequency-inverse document frequency), with which it can be found out how relevant a word is in a document when data is a set of documents:
")
Where:
 is the count of word
  in document
  ,
, is the count of the most common word
  appearing in document ,
 is the number of documents and
 is the number of documents where word appears at least once.
Association algorithms aim to find correlations between different variables in data:
- Users X and Y know each other because they send a lot of email to each other.
- Drugs A and B caused the most side effects for age groups H, K and L.
- Customers who buy product X will likely also buy product Y.
- Customers who have read customer stories usually do not make an electricity contract.
- Making an order is usually cancelled at the payment method selection phase.
The term data mining began to become common already in the 1990s. As techniques developed and expanded to cover more different algorithms, the term machine learning was launched. The boundary between concepts is vague, and within the framework of this course they can be understood as synonyms. By deep learning is meant, simply put, the combination of different data mining techniques into an entity that mimics human decision-making in its complexity. In practice, this means that tracing the machine's so-called reasoning chain from a certain input to a certain output is challenging.
Data Management and Related Development
Data warehousing has traditionally been based on storing structured data so that only desired data is filtered from source data, which is then converted to be suitable for the data warehouse. If necessary, data can be restored to source systems. With the generalization of new techniques and domains (e.g. social media and various IoT devices), a rising trend has been so-called data lake solutions. Topologically, a data lake differs from a data warehouse in its lack of structure: usually all data is collected there from source systems, and data is not forced into a predetermined structure, such as tables of a relational database.
Data lake solutions are usually described as a shallow and wide lake, where there is a lot of data from many different source systems. When data is wanted to be reported, analyzed, or mined, a structure suitable for the task is created for it. Whereas the technical implementation of data warehouses is often based on traditional and mature (often also commercial) relational database management systems, techniques fresher in maturity level are used for data lake solutions, of which the most popular is probably the Apache Hadoop framework.
A potential problem of a data lake solution is seen as explosive growth of data, and mixing of unstructured data with each other without efficient metadata management. Gartner uses the descriptive name data swamp for a failed data lake implementation, referring to important information sinking into unnecessary data. A solution based on combining the best aspects of data warehousing and data lake techniques is called data vault. Data vault is usually a solution where both a structured relational database and an unstructured data lake solution are used in parallel.
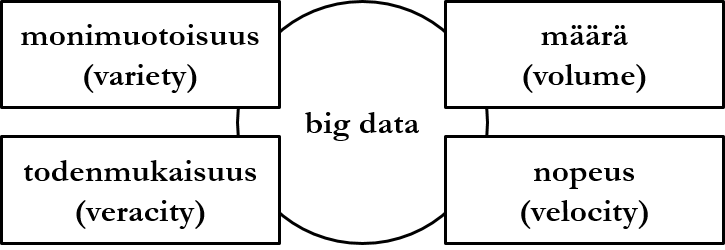
Among other things, the concept of big data is related to data lake solutions. It is a general name for a large amount of certain kind of data, and technologies and challenges related to managing such data. Big data is defined in addition to data amount (volume) by three characteristics:
- By variety is meant that data is not structural, e.g. from the perspective of a relational database data does not reside in predetermined tables and their named columns with determined data types.
- By veracity is meant that data is recognized as possibly partially erroneous, which can mean e.g. outdated, contradictory, or incomplete data.
- By velocity is meant that data flow is continuous and data flows into the database plentifully.
These are the current permissions for this document; please modify if needed. You can always modify these permissions from the manage page.